Yesterday the Office of National Statistics released the next tranche of data on sexuality and gender identity, with a focus on how that intersected across age and ‘sex’.
The ONS analysis doesn’t really offer any surprises, despite the attempts by trans hostile activists to muddy the data by trying to force trans people to respond according to what may be on their original birth certificate.
Unlike my previous article, I’m going to stay strictly within the ONS data here as I look at trends etc.
ONS Findings
Let’s start with the stuff the ONS analysed first.
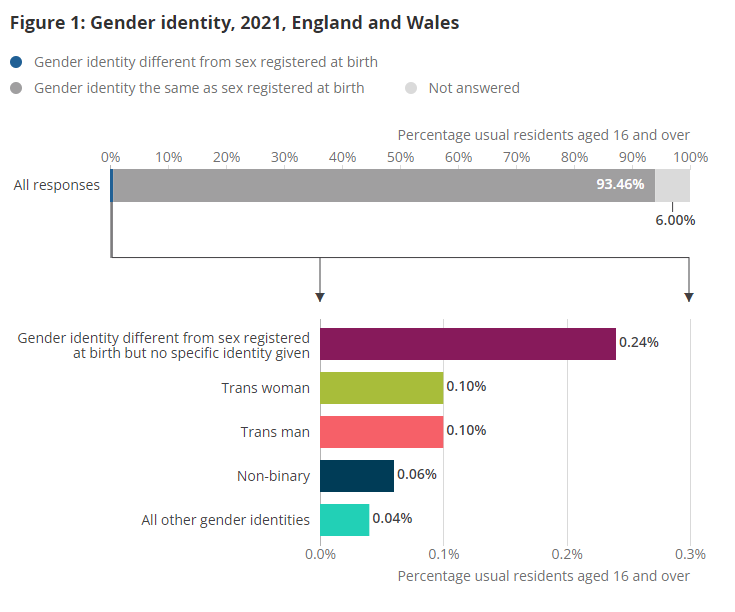
The most interesting finding here is that fully 1% of the 16-24 age group identified as transgender.
Another interesting finding is that in the 16 to 24, 25 to 34 and 35 to 44 age groups, there were a greater proportion of trans people in relation to the trans population than was apparent in the cisgender population.
And lastly is this one, which shows that a greater proportion of trans people appear to be assigned female at birth (AFAB).
There’s some other stuff, but they’re mostly fluff and other than splitting out of the figures for England & Wales, pretty useless.
So, why are these three significant in particular?
Because the 16-24 age group is the first that has not been directly impacted by Section 28.
It’s the first age group that has :
- Experienced both the least amount of social social stigma within it’s peer group
- Grown up with more positive, actually visible social representations of transgender people (the current moral panic not withstanding).
- Received a greater level of support than previous generations, socially, medically and within the family
- Had the benefit of ready access to the internet & social media, with the wealth of knowledge, experiences, support and visibility that brings. It simply cannot be understated how powerful it is to finally find and share experiences with other people like yourself.
As such, this group likely represents the nearest we have to a proper baseline estimate of the actual transgender population as a proportion of the general population.
That’s really important, and interestingly lines up with the most common estimates from other organisations such as Stonewall and GIRES.
Unfortunately due to the ongoing moral panic and social stigma associated with trans women and trans feminine people causing a significant suppression of that cohort, it can’t reliably be used as a cross section of the composition of the trans community by identity.
Digging Deeper
At this point I downloaded all the available data, put it in a big spreadsheet and started looking at it in different ways.
From this point on I’ll be looking at trends over time, and the really important things here are not so much the numerical figures in terms of actual numbers of people, but rather the percentages and ratios and how they manifest and change over time.
Caveats : I’m also going to be using the age groups as a proxy for changes over time. I fully acknowledge that this isn’t perfect, but as this is the very first census to gather this data we can’t compare it to previous ones. So as a proxy these should be regarded as strong indications of change over time, rather than absolutes. As I said, it’s the trends, percentages and ratios that are most important here.
Data by Sex
When we look at binary trans people we can see that as these groups get older they are much more likely to identify and record their sex in line with their experienced identity.
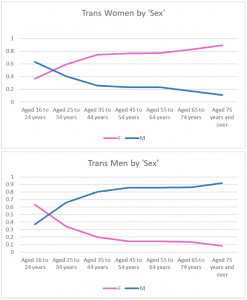
We can also see that more trans men than trans women actually do so, and that trans men are more likely to do so sooner than trans women.
OK, that’s binary trans people, so what about non-binary people?
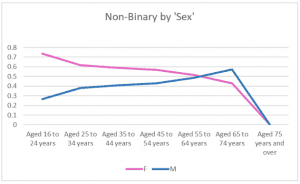
From this we can see that AFAB people are more likely to identify using the specific non-binary label than AMAB people, and that drops off very sharply over 65 years of age – which is likely to do with unfamiliarity with the term, lack of education etc.
One aspect thats often overlooked is that non-binary identities can also be transitional between coming out and adopting a binary identity for some trans people. If we consider this, then then again it makes sense that we see more AMAB people over time defining themselves as Non-Binary, aligning with the known fact that AMAB, trans feminine people tend to come out later in life.
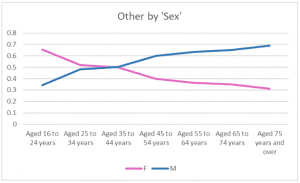
However, when we look at ‘Other Identities’, which the ONS does not specify, it’s a different picture entirely. Both AFAB & AMAB people in older age groups are more likely to identify with specific labels (which I would assume includes identities such as Gender Fluid), than the more general Non-Binary label.
What this could also signify is differing aspects of the ‘trans journey’ as a trend over time between AMAB & AFAB people, which is mirrored with the findings for binary trans people and sex. In short, AMAB people are less likely to identify with a specific label at an earlier age, and find that label later, while for AFAB people it’s the opposite, so its unsurprising to see an increase in this way.
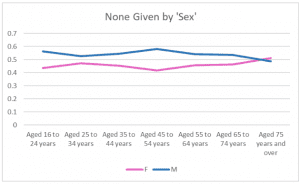
Lastly, the no specific identity category was also predominantly AMAB people. For both AMAB & AFAB people though, this reluctance could be for a number of reasons such as still being in the closet, being unable to say at the time of completing the census or still working things out on a personal level.
What is interesting is that across all groups the proportions are relatively consistent, but we see a spike of AMAB people associated with an age group impacted by Section 28, and another impacted by the current moral panic. More on this in the next section.
Trends and the impact of Section 28
Now it gets really interesting, although I need to note a couple of things before I start.
- As I said earlier, I’m using this data as a proxy representation of changes over time, instead of a snapshot of specific age groups, although there is some overlap. We can do this as this data also provides a snapshot of these groups’ experiences, and as such it offers some insight across a generational timeframe.
- I’ve reversed the age groups from right to left, to make understanding these as representing changes over time a little easier. As such the timescales aren’t exact, but representative
- The red band indicates the groups that were directly affected by Section 28.
- To determine who may have been affected by Section 28, I’ve used those who would have been 11 years old as the starting point (aligning with starting secondary school) and 18 years old (aligning with leaving college or 6th form) – meaning that pretty much 2 generations, the 35-44 and 45-54 age bands were directly and completely affected.
- The 55-64 and above age groups would have been affected by the surrounding moral panic prevalent at this time, explaining the decreases here, and the 25-34 age group would have also been affected as institutions gradually made positive changes.
Let’s look at binary trans people first :
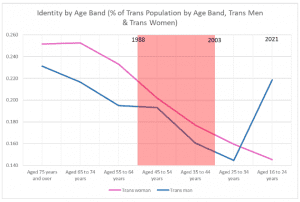
Firstly, we need to remember that the proportional differences between trans men and trans women are quite tiny, meaning that focusing on a smaller range makes differences look bigger than they are on the graph.
As we can see, prior to and during Section 28 the number of binary trans people dropped sharply, most likely to do with the moral panic that occurred prior to it’s introduction as well as the effect of the legislation itself. However, both groups generally drop at similar rates.
However, if we assume that the 65+ age groups represent a somewhat accurate proportion of both trans men and trans women, we can see that the impact of Section 28 was absolutely devastating for both groups.
It is only within the 16-24 age group that we see some signs of recovery. Remember those claims of a ‘4000% increase in AFAB young people transitioning’? Here we have another data point that shows the fabricated concerns around that being an absolute lie. While it’s true there has been a large increase in AFAB young people seeking help, that increase is demonstrably a result of the trans man / trans masculine section of the trans community bouncing back to previous levels, and is only just starting to reflect the pre Section 28 situation.
It’s a bounceback caused by greater social acceptance and the ability for AFAB people to explore who they are at an earlier age without being stigmatised for it, something that AMAB people have not had the advantage of, with further suppression being caused by the demonisation of trans women and trans feminine people in the current anti-trans moral panic.
We can also ‘reverse’ this graph for trans women, and if we do it reflects the known fact that trans women are more likely to ‘come out’ at a later age than trans men – which we also see reflected in the ‘Non-Binary by sex’ graph above if we reverse that.
What about non-binary people?
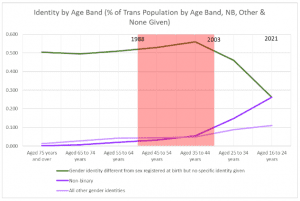
During Section 28 we see that the proportions of both Non-Binary and ‘Other’ specific identities remain fairly static, and the increase in the number of those not willing to declare an identity would be consistent with staying in the closet / denial of identity / lack of awareness due to Section 28.
The increases in the proportions of both Non-Binary and ‘Other’ specific identities coincide with both the end of Section 28 coupled with increased awareness of both. What’s really interesting is that both of these increases also correspond with a large drop in those who did not provide a specific label.
Parting Thoughts
As we can see, this data provides some really interesting correlations that back up previous assumptions made across the community.
- The 16-24 age group most likely represents the actual proportion of the trans population compared to the numerical data across all groups, but is not representative of trans women as a group. As such this 1% is likely to be a more accurate baseline, but I would expect it to be higher for some of the reasons below.
- The ‘4000% increase in AFAB young people’ is pure hysteria – we know that the referral rates are still far below the actual trans population figures, with AFAB people getting closer to the actual proportion of the trans population and AMAB people still lagging far behind. Rather, the proportion of trans men appears to be approaching pre Section 28 norms.
- Section 28 had a devastating effect on the trans and non-binary community, especially for binary trans people. That effect has been profoundly worse for trans women and trans feminine people. Moreover, this has never recovered because where in conjunction with the current moral panic it suppresses and creates fear in trans people revealing their true identity.
- Both Trans Men and Trans Women are more likely to identify their sex as their experienced identity, especially as they get older.
Strangely the ONS doesnt appear to have released or have a planned release for how sexual orientation and gender identity interact yet, which seems like a bit of an oversight.
I’m also going to look at the figures for sexual orientation soon anyway as I need to update the ‘Transing the Gay Away’ articles, given we now have more proof positive that LGB people are not being ‘erased’ or ‘transed’, despite the continued hyperbolic claims by those associated with anti-trans hate groups and faux charities.





 To provide the best experiences, we use technologies like cookies to store and/or access device information. Consenting to these technologies will allow us to process data such as browsing behaviour or unique IDs on this site. Not consenting or withdrawing consent, may adversely affect certain features and functions.