Recently the first tranche of data from the 2021 Census for England & Wales in relation to trans people was released by the Office of National Statistics.
In some ways it makes for interesting reading, but ultimately it doesn’t really tell us anything we didn’t already know, and in others it leaves things more muddied overall, thanks to making the “Is the gender you identify with the same as your sex registered at birth?” question entirely optional.
So, what do we have to work with, and what does it give us in terms of solid or speculative data?
Content warning first, as there follows some archive links to known trans hostile publications, but here we will take an open and hopefully more objective look, as the trans hostile misinformation merchants have already made all sort of claims based on wildly misinterpreted data, such as ‘Women’s Place UK’ laughingly demanding an apology from Stonewall for ‘overestimating the trans population’ based on a ludicrous article from that bastion of unbiased and accurate reporting (stop laughing) on trans people, The Spectator.
Some of which we will look at as we go through this.
Establishing a Baseline
The most solid data the Census provides us with is that it establishes a minimum baseline for the trans and non-binary population.
In total, 45.4 million (93.5%) answered “Yes” and just over 262,000 (0.54%) answered “No” to the optional question on gender identity, so that gives us a solid 0.54% as a hard minimum population figure for the UK’s trans population.
We will look at how that splits out in a bit.
The first major error the misinformation merchants make is by claiming that only binary transgender people (trans men and trans women) are trans, when the actuality is that the term transgender is really broad, and refers to anyone who isn’t cisgender (someone whose identity aligns with the ‘sex’ on their birth certificate).
Which is why you see claims such as ‘only 0.2% are trans’ – which is outright wrong, and deliberate misinterpretation of the data based on how best the trans hostile activists and right wing idiots can use it to attack the whole community.
What about the potential maximum trans population?
So, if 0.54% is our hard minimum population, what’s the maximum? This is where it gets a little more interesting, although much more speculative – because we have some ‘known unknowns’ which is going to drive the figure upwards.
- 6% of the population didn’t answer the optional question at all, so that means that we already have a potential +6% margin of error.
- A percentage of transgender people will have answered the ‘sex’ question as their lived, experienced sex / gender, effectively stating that they are cisgender – which is no different from previous census data gathering. The attempts by trans hostile groups to screw up the census data by getting the guidance changed may have influenced this – I personally know of a number of trans people who refused to complete the optional question because of the actions of the trans hostile groups (so they would be in the 6%), and I know of others who completed it and answered ‘yes’ to the optional question – so they would have been recorded as if they are cisgender. Basically, most binary trans people use ‘man’ or ‘woman’ exclusively, and do not use ‘trans man’ or ‘trans woman’
- Some people will not have been able to be open about who they are due to personal circumstances, or will have had others complete their data, so they would have been recorded as if they are cisgender too.
- we know that some trans hostile activists planned on trying to muddy the data further by using ‘other gender identities’ because they didn’t like the way the question was posed, although that group is likely statistically insignificant, and we can’t tell yet by how much as we don’t known what identities were recorded under ‘other’
All of which effectively means that some of the ‘93.5%’ recorded as cisgender will be trans, being counted under both ‘Yes’ to the optional question, and under the 6% who didn’t answer it at all.
So where does that leave us?
Well, in theory, if we count that 6% who didn’t answer as if they are all transgender, that gives us an upper limit for the trans population of 6.5%. In reality that’s pretty unlikely, but that’s the result of making it optional rather than mandatory.
If we assume the 6% who didn’t answer is split roughly along national lines, and being generous and assuming that 0.54% is somewhat accurate for the trans population – that gives us an additional 15,730 trans people, bumping the figure for the whole transgender population to 0.57% – which is close to the figure from the Canadian Census.
We have no effective way of estimating or speculating what proportion of people are trans from my third and fourth points, but this would also be additional.
But in effect, what this gives us is a new, slightly more speculative baseline of 0.57%, with the actual number of trans people somewhere north of that for the various reasons I’ve highlighted, potentially up to an unlikely 6.5%.
Or in numbers :
Established Baseline (0.54%) : 262,113 trans people
Speculative Baseline (0.57%) : 277,843 trans people
Speculative Maximum (6.5%) : 3,176,768 trans people
So the reality is that the size of the trans population in England & Wales is still relatively unknown, but somewhere between 262 thousand and 3.2 million trans people.
The Spectator claimed, via some anonymous contributor calling themselves Steerpike, that Stonewall originally estimated 1% of the UK population (not just England & Wales, which the Census covered) is transgender, or around 650 thousand people. The truth is that data comes from multiple sources, and personally I recall coming across it via information from GIRES, not Stonewall.
So both WPUK, the Spectator and ‘Steerpike’ are erroneously, and likely deliberately conflating data for England & Wales as if it applies to England, Wales, Scotland and Northern Ireland in entirety. Still, it’s not unknown for trans hostile groups and activists to deliberately misrepresent data on this scale and it won’t be the last, as we are already seeing.
So, sorry WPUK – Stonewall has absolutely nothing to apologise for nor to retract, because the 0.54% is a minimum figure and not a maximum, because of the unknown factors already highlighted above, and it applies to England & Wales only. And as we can see, ‘Stonewall’s’ figure of 1% falls well within the range indicated above.
What about how is the data split by identity?
So, let’s go back to the hard data we have, and look at how the 0.54% split out in terms of specific identities.
This is where it starts to get a lot fuzzier and becomes significantly less useful – a fact that trans hostile groups are using to muddy the waters again.
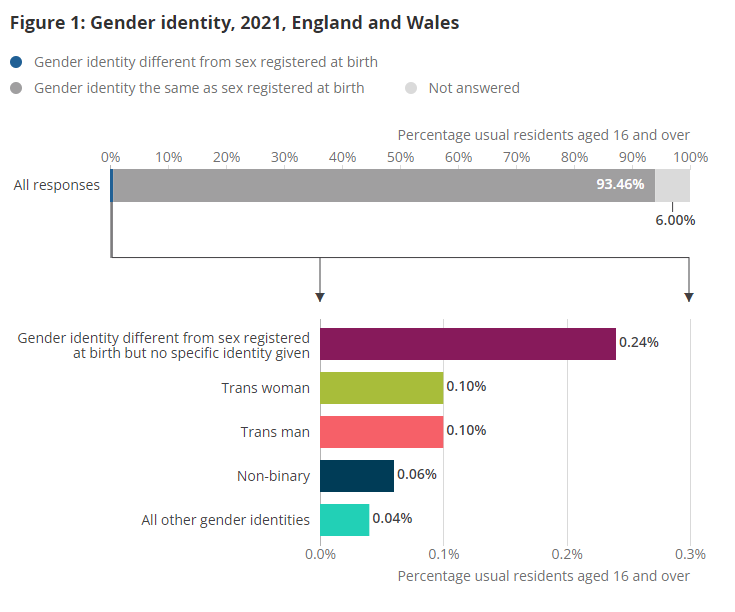
Here’s the data from the ONS.
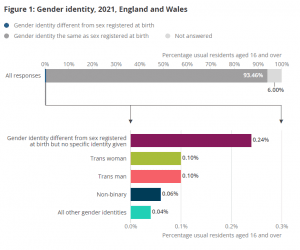
Out of our 0.54%, almost half didn’t state a specific identity – and there’s no listing for what ‘all other gender identities’ actually covers. Whether that will come later we don’t know, but it’s not listed as a release from the ONS at this time.
There’s also the fact that, as mentioned above, many (most?) binary trans people don’t refer to themselves as ‘trans men’ or ‘trans women’, but rather just ‘men’ and ‘women’. As we’ve already established, it’s highly likely that most of these either didn’t answer the question at all, or are recorded as if they are cisgender.
In other words, it’s an erroneous assumption that all binary trans people call themselves ‘trans men’ and trans women’. What we have here is 0.1% of the population that are happy to use that label for themselves, and not the actual number of ‘trans men’ and ‘trans women’.
However, what the split does do is provide some additional solid minimums to our 0.54% total population figure.
So, let’s get a little speculative on these as well.
If we assume the split shown by the census data also applies to those who didn’t provide a specific identity then that gives us another 0.09% (or around an additional 41 thousand people) for each of the trans men, trans women & non-binary categories.
Factoring the National LGBT Survey
The National LGBT Survey gave us other data which we can use to try and get a potentially more accurate figure for the trans population.
If we look at Annex 3 we get a different split of how trans people may actually identify.
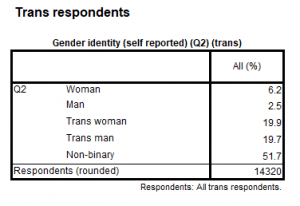
If we use these for our split instead, we end up with an additional 0.067% for trans women, 0.057 for trans men and 0.133% for non-binary people, bringing our final speculative split to 0.16% for trans women, 0.15% for trans men, and 0.24% for non-binary people.
We could try and use the figures for ‘woman’ and ‘man’ above, but in reality they don’t make much difference in terms of those we already know to be transgender, but that still leaves us with an unknown number of both binary and non-binary people who may have answered as if they are cisgender, which we cannot factor in at all.
Further data around how the official census figures split based on assigned sex at birth and age won’t be available until next week, so we may revisit things then.
Other Demographic Data
The Census did throw out some other potentially useful info, which again should be considered as minimum baseline data.
For example, we know that ‘University’ towns such as Oxford, Cambridge, Bath etc all have much higher percentages of people who are transgender, which aligns with known data showing that younger trans people are more likely to have come out much earlier in life.
There’s also higher percentages of trans people living in socially deprived areas, aligning what we already know about trans people being more likely to be living in poverty or unemployed, which often coincides with deprived areas in big cities too, reinforcing that city urban areas are more likely to be more socially accepting of trans people, as well as meaning trans people trying to live closer to established support services.
But there’s one aspect that no one appears to have touched on.
Healthcare
It’s roughly estimated that the current waiting list across England & Wales to access transition related healthcare is around 26 thousand people. The London GIC alone has a waiting list of almost eleven and a half thousand people.
If we assume they are all binary trans people, that means that over a quarter the entire binary trans population is on a waiting list for trans related healthcare.
If we include non-binary people (who in reality the NHS generally don’t acknowledge exist, let alone provide any help for), then that figure is around 11%.
In other words:
Between 11% and 26% of the trans population are waiting for help on the NHS, adding another layer of evidence to the ongoing trans healthcare crisis in the UK.
You can access the ONS data on it’s interactive map here :





 To provide the best experiences, we use technologies like cookies to store and/or access device information. Consenting to these technologies will allow us to process data such as browsing behaviour or unique IDs on this site. Not consenting or withdrawing consent, may adversely affect certain features and functions.